Visualization is the key
Visualization helps me very often in daily work. Working in a dynamic IT environment we struggle with information overload and dependecies. Developing products usually requires many teams engagement so our daily basis is closely related to meetings, planning, and analysis which causes that we have to be very precise during the talk. Unfortunately, clear communication and being on the same page with your team is non-trivial. Of course, you can work on effective communication but it could take a long time so visualization can be a better cure for this (a faster way but I cross my fingers 🤞 for your learning process).
How does it work?
Create colorful cards and use arrows to represent relations between them. Thanks to visualization it is much easier to trace the blocker or problem.
Tools
Examples
- roadmap (sprint, quoter, year)
- dependencies beetwen team
- action point
- implementation plan
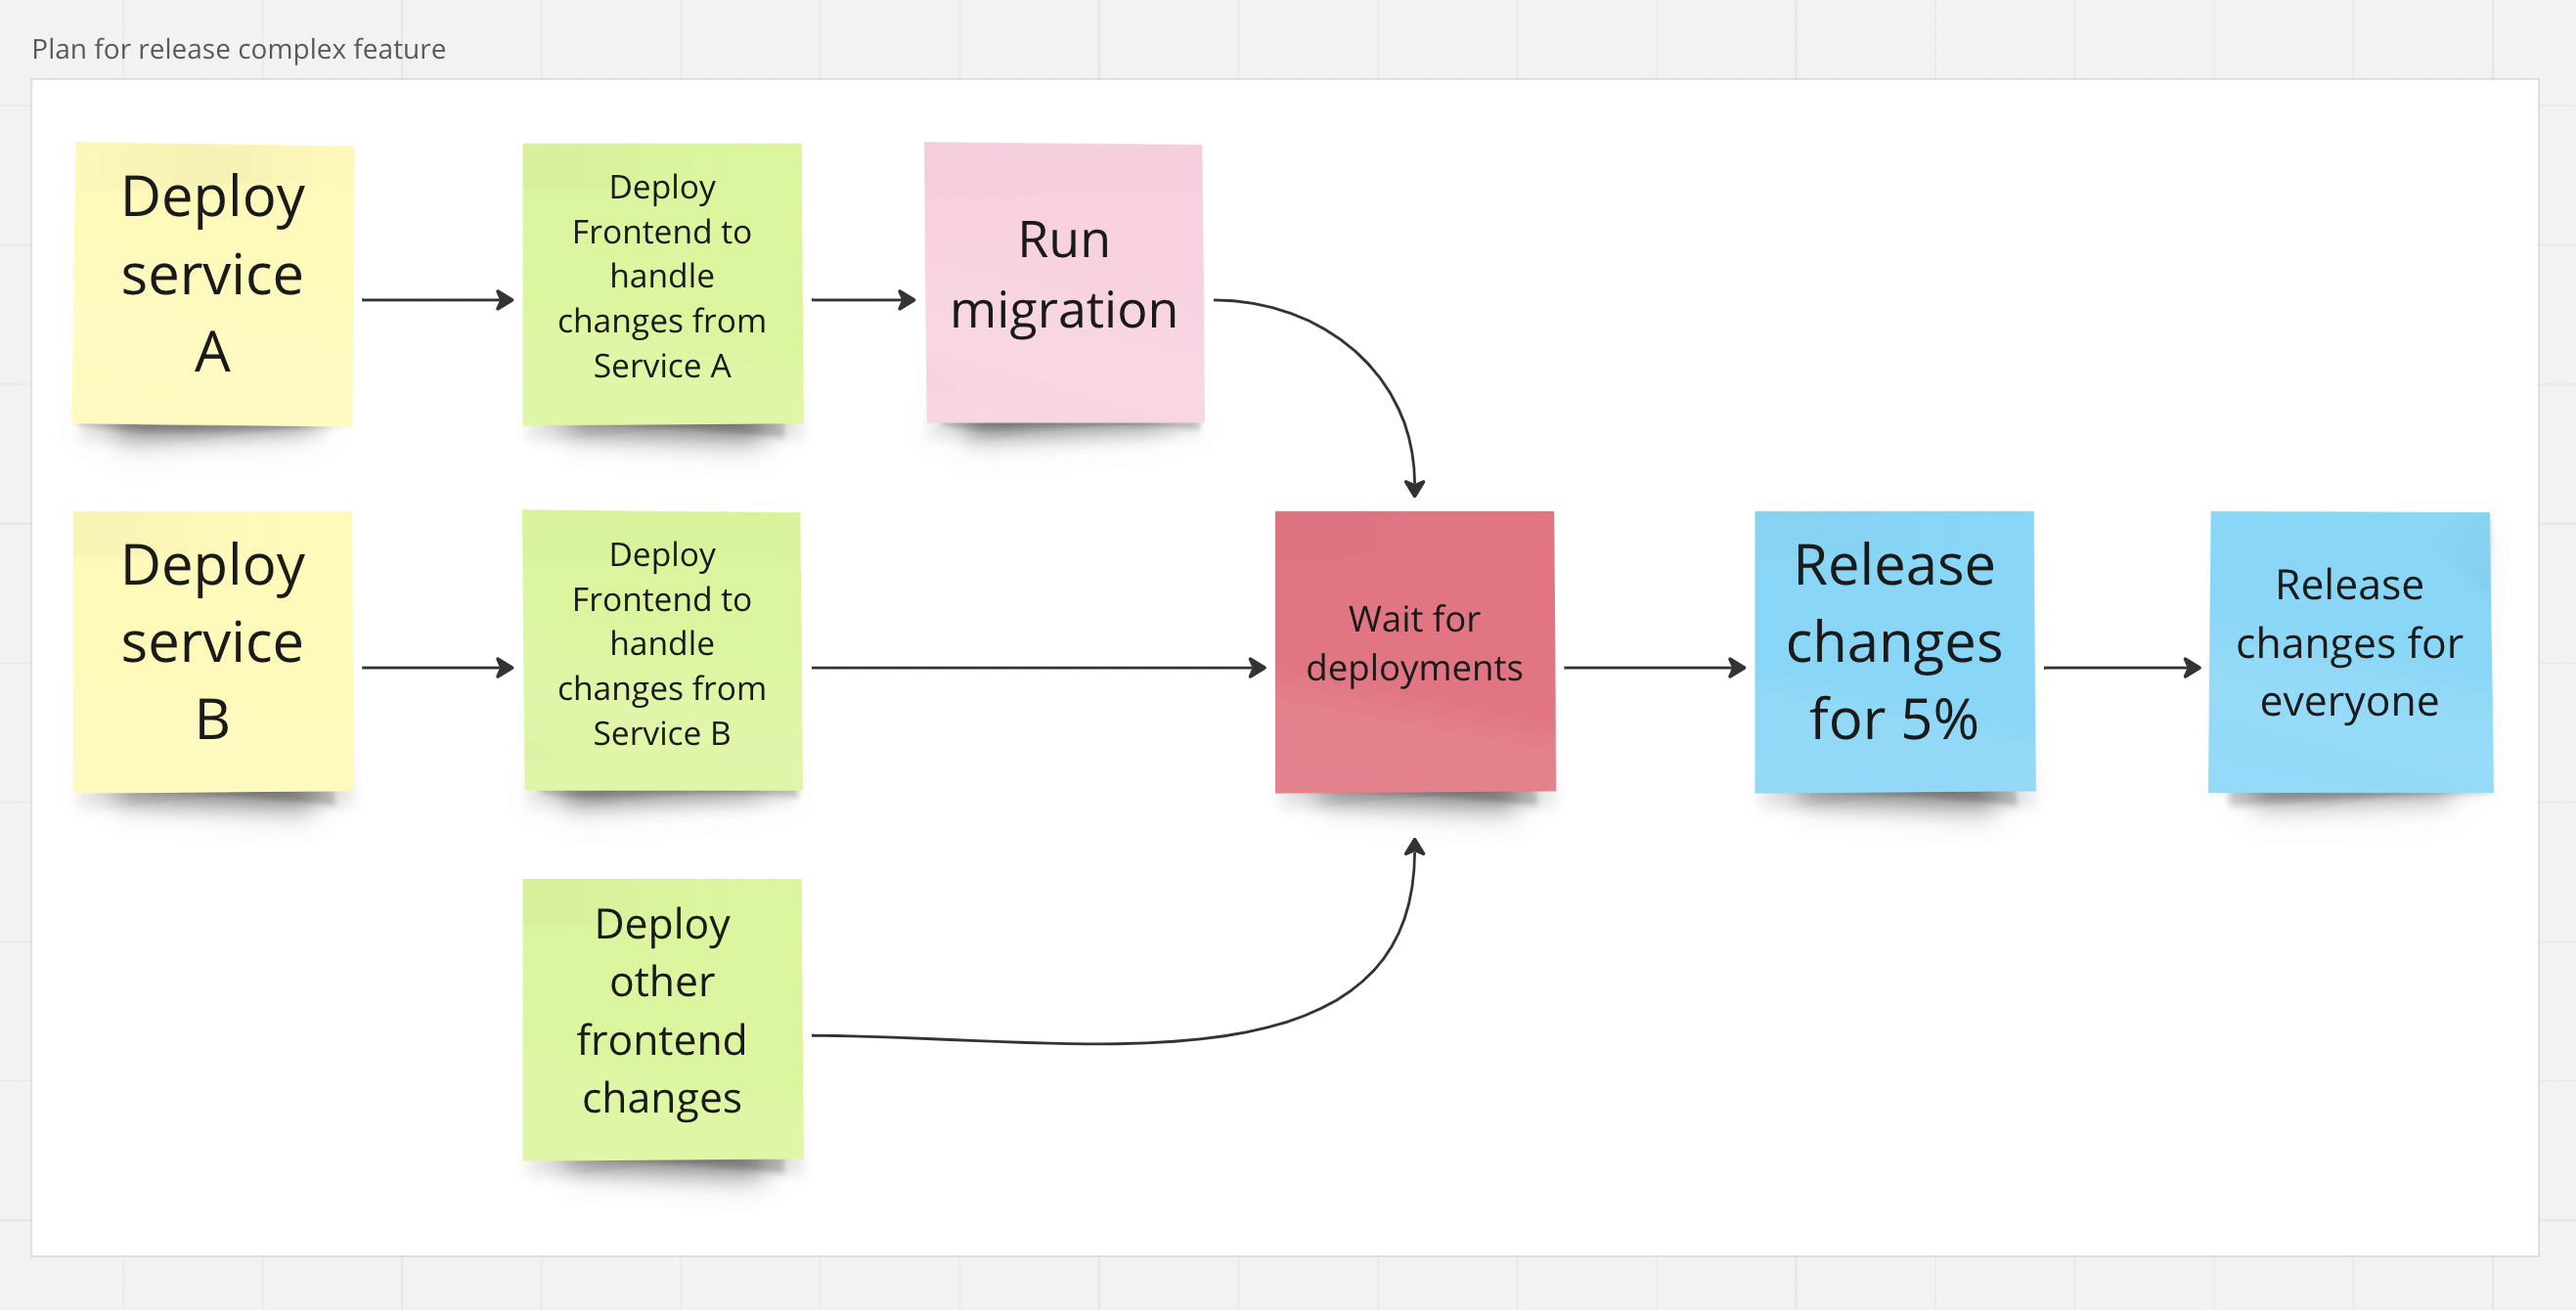
- deployment plan
For example, when we create a release plan, we can notice so much more from the big picture
- blockers and problems
- potential bottleneck
or get the ideas
- maybe we should create the revert plan
- how much time we should wait after release for 5%?
- which approach do we want to use to make deployments?